Transparency in the entire line
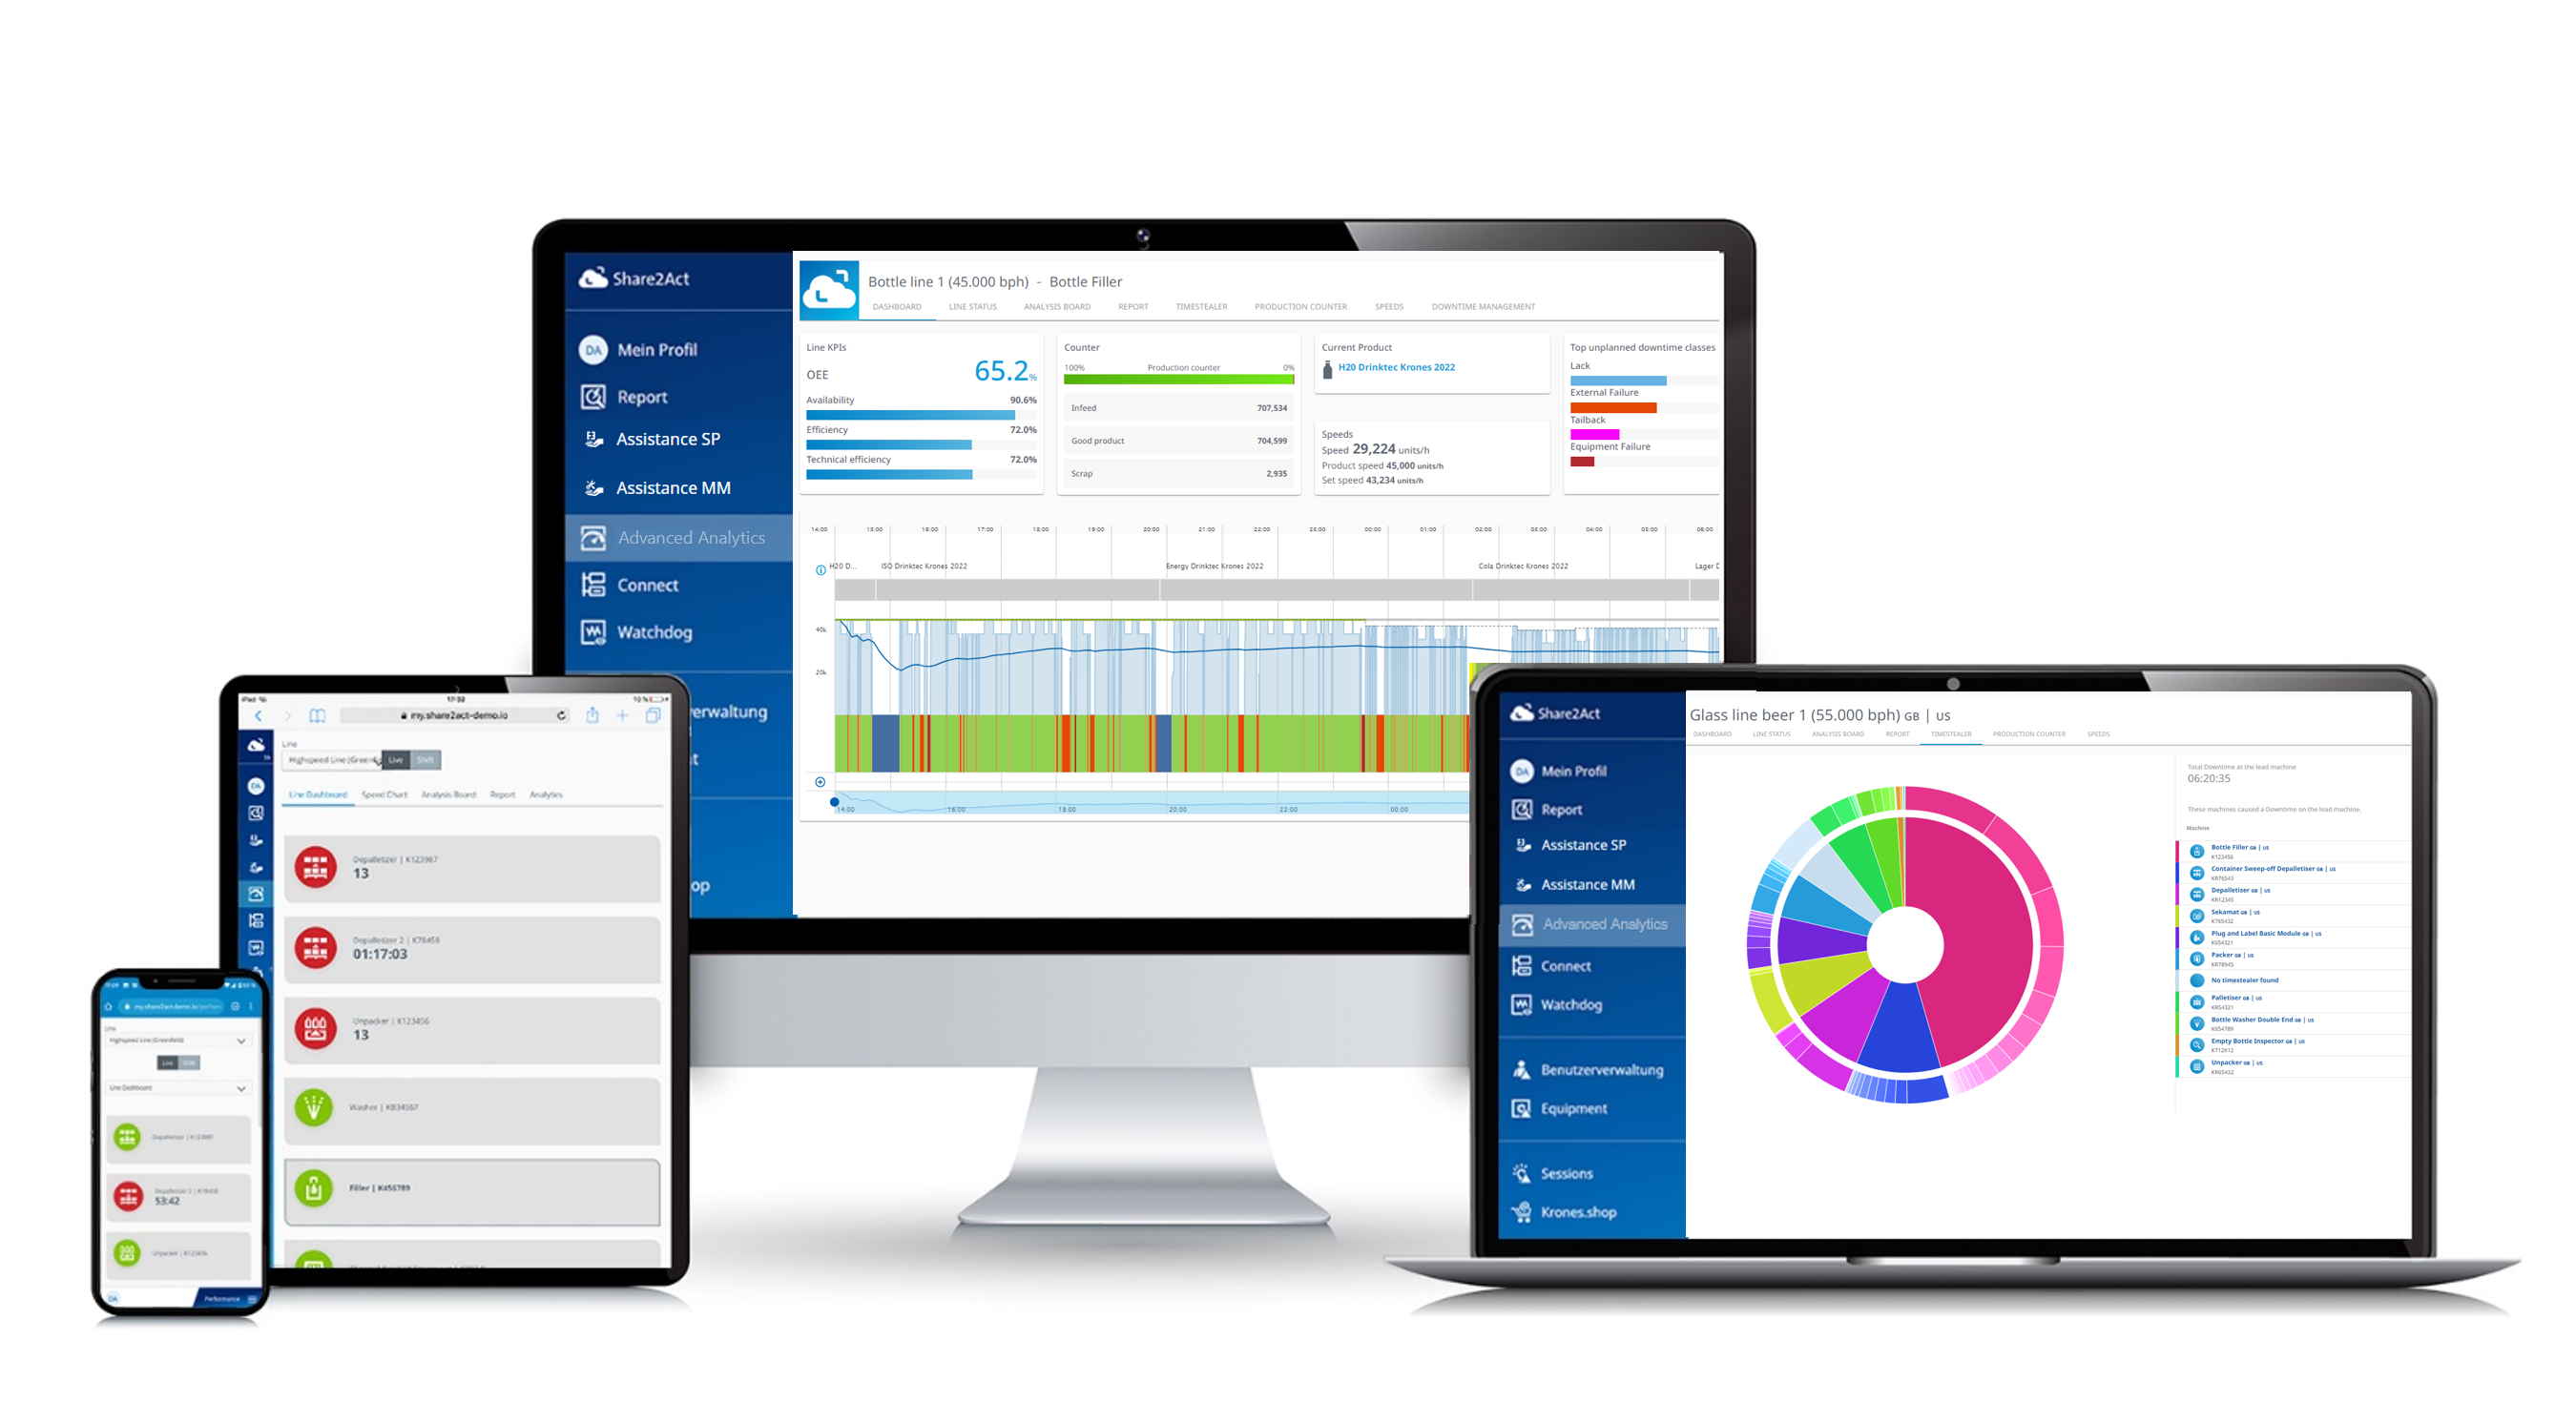
An incomplete or non-transparent data record is now a thing of the past thanks to Advanced Analytics. This service provides you with a live overview of the current status of your machine and also visualises the most important KPIs of your production process. Thus, you can find out exactly which areas have the untapped potential to continue increasing your line productivity.
At a glance:
- Live overview of the current status of your machine
- Visualisation of the most important KPIs of your production process
- Identification of areas with untapped potential to further increase your productivity
- Available in three different versions, depending on the desired information and reports


- Automatic classification of downtimes based on the machine status
- Automatic identification of downtimes, fault-causing machines and fault causes
- Data enrichment through additional information entered by the operator (manual reclassification, supplementary notes, reason codes)
- Automatic classification of downtimes based on the machine status
- Automatic identification of downtimes, fault-causing machines and fault causes
- Data enrichment through additional information entered by the operator (manual reclassification, supplementary notes, reason codes)

- Schematic overview of your line
- Machine status including downtime counter
- Current shift KPIs and Pareto analysis of downtimes
- Visualisation of operation times and downtimes on a time axis
- Speed diagram
- Schematic overview of your line
- Machine status including downtime counter
- Current shift KPIs and Pareto analysis of downtimes
- Visualisation of operation times and downtimes on a time axis
- Speed diagram

- Illustration of loss categories in a waterfall diagram
- KPI calculations at line and machine level
- Reports on produced units and speed
- KPI trend analysis
- Illustration of loss categories in a waterfall diagram
- KPI calculations at line and machine level
- Reports on produced units and speed
- KPI trend analysis

- Analysis Board for the visualisation of machine downtimes
- Analysis of time stealers and fault causes for detecting bottlenecks
- Downtime reports and failure analyses for the detection of fault causes
- Analysis Board for the visualisation of machine downtimes
- Analysis of time stealers and fault causes for detecting bottlenecks
- Downtime reports and failure analyses for the detection of fault causes
Providing support in all areas of production
Benefits to you
Cost-efficiency
Cost drivers for production downtimes are identified and continuously reduced.
Time savings
Optimise your time requirements thanks to the fast and comprehensive processing of all data.
Global availability
Use Advanced Analytics 24/7 – regardless of your location and selected end device.
Increase in the Overall Equipment Effectiveness
Obtain an overview of machine data and KPIs and thus create the foundations for increasing your Overall Equipment Effectiveness.
Transparency
Advanced Analytics records and logs all of the necessary status and process data of your production line.
Overview
The system translates a large amount of complex information about your line into informative key figures and thus makes it possible to develop sound actions.